Metrics of Movement: How Travel Fatigue Reshapes Point Spread Calculations in International Basketball
Written by Klara Hoffmann · Jun 20, 2026
Metrics of Movement: How Travel Fatigue Reshapes Point Spread Calculations in International Basketball
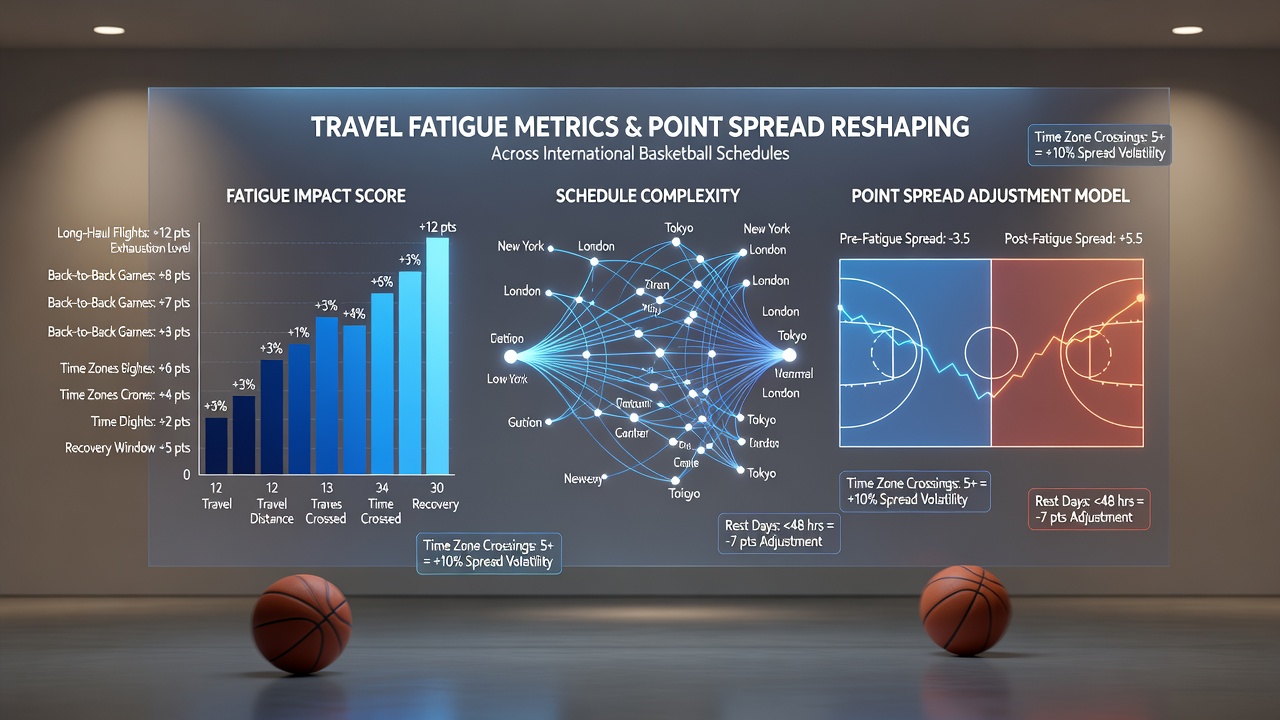
Travel fatigue metrics have become central to point spread calculations in international basketball because they quantify how flight duration, time zone changes, and recovery windows alter team performance across different schedules, and data from multiple leagues now feeds directly into these models. Researchers track variables such as sleep disruption, circadian rhythm shifts, and accumulated physical load, then integrate those numbers into algorithms that adjust expected margins before games tip off.
Core Components of Travel Fatigue Measurement
Analysts collect raw inputs that include total air miles, number of time zones crossed, and days between games, while they also factor in direction of travel since eastward flights tend to create greater adjustment challenges than westward ones. Studies from sports science departments show that teams crossing four or more zones lose measurable efficiency in shooting percentages and defensive transition speed during the first forty-eight hours after arrival, and these patterns hold across both club and national team competitions.
Performance databases maintained by leagues such as EuroLeague and the NBA compile box-score outcomes against travel logs, which allows modelers to assign numerical weights to each fatigue element. One dataset covering five seasons revealed that visiting teams arriving the same day as a game covered fewer transition opportunities and recorded higher turnover rates, prompting oddsmakers to widen or narrow spreads by fractions of a point based on the calculated deficit.
Integration into Point Spread Models
Bookmaking operations blend fatigue scores with traditional factors like home-court advantage and recent form, yet the fatigue layer receives increasing emphasis when schedules feature compressed international windows. Algorithms now output adjusted point spreads that reflect projected efficiency drops, and these revisions appear in pre-game lines for events ranging from FIBA qualifiers to club friendlies played on multiple continents.
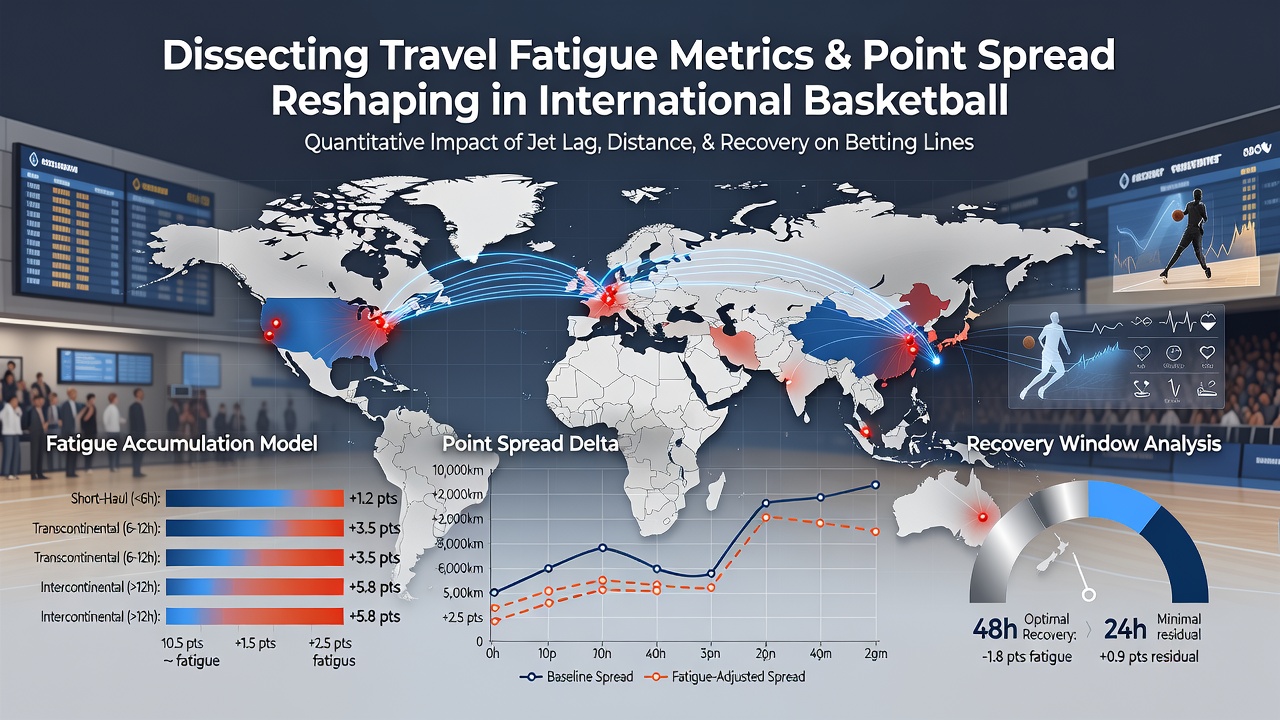
Statistical services supply granular inputs that include historical recovery curves for specific rosters, allowing models to differentiate between veteran-heavy lineups that manage jet lag better and younger squads that show sharper declines. Observers note that spreads for games in Asia or Australia often move several points once final travel itineraries become public because the metrics quantify how many hours teams spend in the air versus on the court.
Evidence from Recent International Schedules
During the 2025-2026 club season, teams participating in the new intercontinental tournament faced back-to-back long-haul flights that coincided with June 2026 group-stage matches, and early results indicated measurable drops in three-point accuracy for squads traveling more than twelve hours. League statisticians cross-referenced those outcomes with pre-game spread movements and found that lines incorporating fatigue metrics aligned more closely with final margins than lines relying solely on ranking differentials.
National federations in Europe and South America have begun publishing anonymized travel and performance summaries that feed into academic reviews, while a Canadian research group at the University of Toronto released findings showing that circadian-adjusted rest protocols can offset roughly half the typical efficiency loss. University of Toronto sports science reports document these offsets through controlled observations of elite athletes.
League-Specific Adjustments and Data Sources
Different competitions apply fatigue metrics at varying levels of precision, with the NBA maintaining detailed internal logs that include charter flight data, whereas FIBA events rely more on publicly reported itineraries and estimated recovery times. Modelers therefore weight each league's data differently when building global point spread frameworks that cover both domestic and cross-border fixtures.
Additional inputs come from wearable device aggregates that track heart-rate variability and sleep duration, and these streams allow continuous refinement of the algorithms. A report issued by the Australian Institute of Sport outlines how such biometric layers improved prediction accuracy for teams competing in Oceania-based tournaments, where long flights from either hemisphere create pronounced recovery gaps. Australian Institute of Sport research summaries provide supporting benchmarks for these biometric correlations.
Conclusion
Travel fatigue metrics continue to embed themselves into point spread calculations because they supply quantifiable edges that traditional ranking systems overlook, and ongoing data collection across international schedules ensures these adjustments remain current. As more leagues release detailed travel and performance records, the models gain precision while still reflecting the same core relationship between movement, recovery, and on-court output.