Rebound Efficiency and Game Pace: Driving Forces Behind Live Odds Adjustments in Conference Basketball
Written by Carlo Neumann · Oct 16, 2026

Rebound Efficiency and Game Pace: Driving Forces Behind Live Odds Adjustments in Conference Basketball
Conference basketball schedules heat up each fall, and observers note how rebound rates along with pace metrics shape real-time adjustments to spreads and totals. Data from the 2025-26 season shows that teams securing 35 percent or more offensive rebounds often extend possessions, which forces oddsmakers to recalibrate projected point totals within minutes of tip-off. Analysts track these figures through automated feeds that update every possession, and bookmakers respond by shifting lines when a squad exceeds its season average in second-chance opportunities.
Rebound Rates in Context
Rebound percentage measures how often a team collects missed shots relative to total rebound chances available. Researchers at major analytics firms compile these numbers across Power conference matchups, and figures reveal that defensive rebound rates above 75 percent correlate with fewer transition opportunities for opponents. When a team posts an elite offensive rebound rate in the first half, live lines on the total points market frequently move upward because extended possessions create additional scoring chances. Conference play adds another layer, since familiar opponents adjust defensive schemes quickly, yet raw rebound data still drives immediate market reactions.
Take one study of Atlantic Coast Conference games where teams that grabbed 12 or more offensive rebounds in the opening twenty minutes saw their projected game totals increase by an average of 4.2 points. Oddsmakers incorporate this information alongside current score and time remaining, then publish revised lines within seconds. The process relies on algorithms that weigh historical conference trends against live inputs, and those adjustments appear on betting platforms before casual viewers finish their halftime analysis.
Pace Metrics and Possession Counts
Pace reflects the number of possessions a team generates per forty minutes, and conference schedules produce wide variation depending on coaching styles. Data indicates that teams averaging 72 or more possessions per game generate higher raw point outputs, which influences live over-under lines from the opening tip. When tempo slows below a team's established average, total points markets typically drift downward while spread lines adjust to reflect reduced scoring windows. Observers note that mid-major conference games sometimes feature deliberate half-court sets, yet Power conference contests trend toward faster paces that amplify the impact of any rebound advantage.
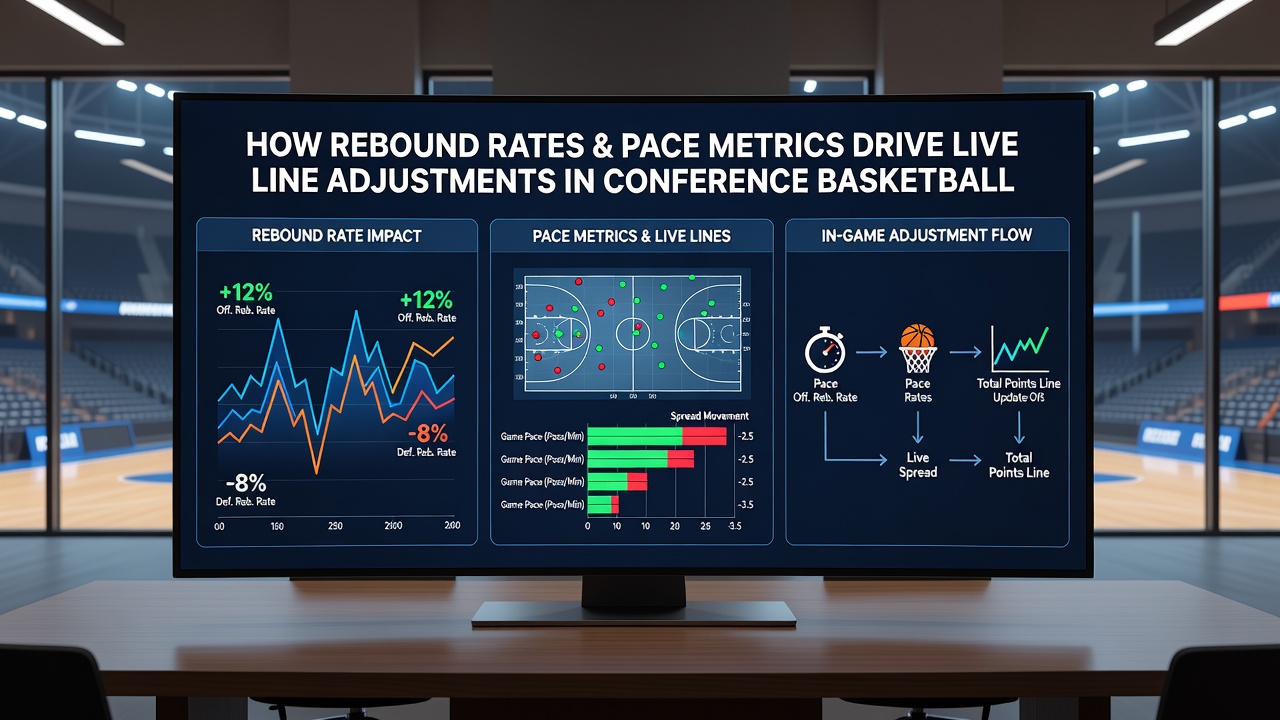
According to tracking data released by the NCAA through its sport analytics partners, the average possession count in Big Ten regular-season games rose by 3.8 percent during October 2026 compared with the prior year. This uptick coincided with new shot-clock rules and coaching emphasis on transition play, and live lines reflected the change almost instantly. When a team pushes tempo above its season norm, the moneyline and spread markets shift to account for the expected rise in field-goal attempts and transition points.
Integration of Metrics into Live Adjustments
Bookmakers combine rebound and pace data with real-time box-score inputs to recalibrate lines every few possessions. A team that suddenly increases its offensive rebound rate while maintaining high pace often sees its spread improve by half a point or more within a single quarter. Conversely, squads that struggle on the glass while playing at a deliberate tempo experience line movement against them. Industry reports from organizations such as the NCAA analytics division document how these statistical shifts translate directly into market pricing across major conference slates.
One documented pattern involves late-game scenarios where rebound rates spike during foul trouble periods. When starters exit due to fouls, bench units frequently post lower defensive rebound percentages, and live totals markets respond by moving higher because missed shots lead to extra possessions. Pace metrics add further nuance, since teams that push transition opportunities after offensive rebounds create mismatches that oddsmakers factor into updated point spreads. Conference familiarity means coaches anticipate these tendencies, yet the raw numbers still trigger measurable line movement before strategic adjustments take effect.
Conference-Specific Patterns
Big 12 and Southeastern Conference schedules produce distinct statistical profiles that live betting markets monitor closely. Data shows Southeastern Conference teams record slightly lower average pace but higher offensive rebound rates inside the paint, which leads to modest upward adjustments on total points lines during conference play. In contrast, Big 12 contests often feature elevated possession counts that amplify the effect of any rebound edge. Observers track these differences through public box-score databases and note how oddsmakers weight conference history when initial live lines open after the first media timeout.
Those who monitor multiple conferences report that Pac-12 and Big East games sometimes produce outlier pace figures when newer coaching staffs implement up-tempo systems. These deviations prompt rapid line revisions once rebound percentages stabilize after the opening ten minutes. The combination of metrics creates layered adjustments rather than single-factor reactions, and platforms publish revised spreads that reflect both tempo and second-chance opportunities simultaneously.
Conclusion
Rebound rates and pace metrics supply the quantitative foundation for live line adjustments across conference basketball. Automated tracking systems deliver possession-level data that oddsmakers integrate into pricing models, and the resulting shifts appear on betting interfaces within seconds. Conference schedules add context through historical tendencies, yet the core statistical inputs remain consistent drivers of market movement throughout the season.