Schedule Density's Subtle Impact on Basketball Point Spread Dynamics
Written by Rafael Powell · Jul 9, 2026
Schedule Density's Subtle Impact on Basketball Point Spread Dynamics
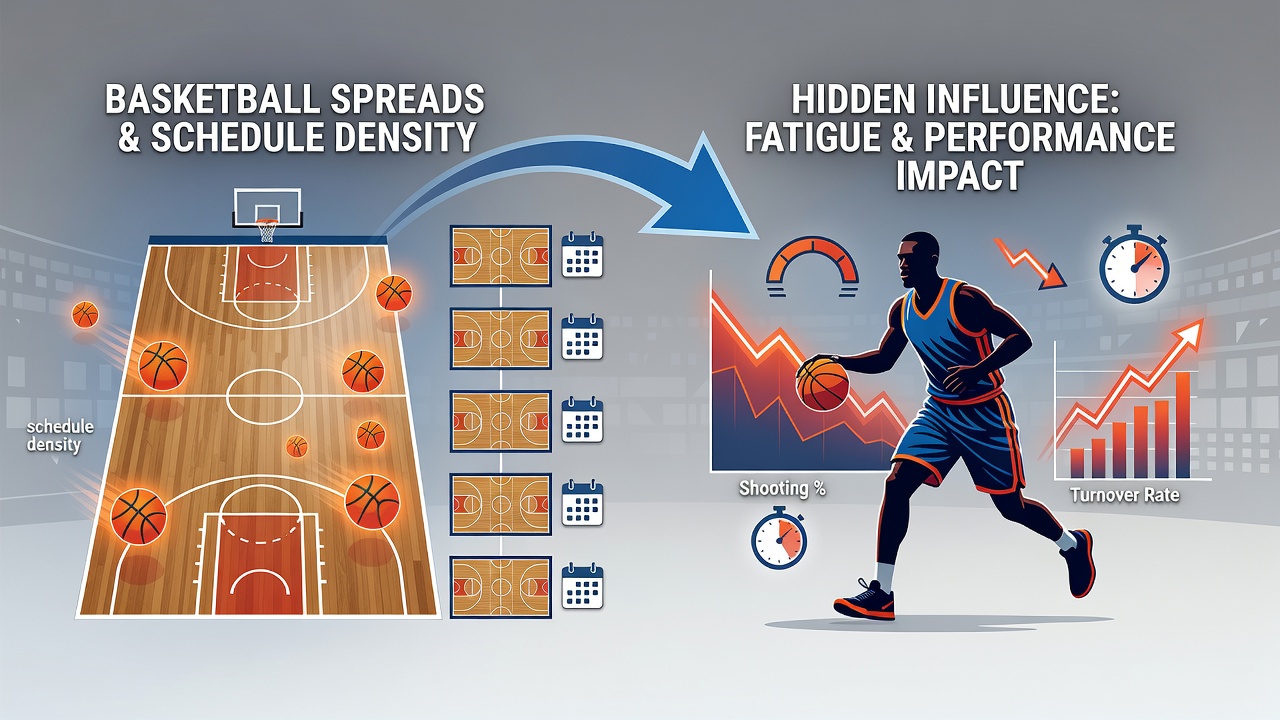
Schedule density refers to the concentration of games within short timeframes, and data from recent NBA seasons shows it correlates with measurable shifts in team performance metrics that influence point spread outcomes. Teams facing consecutive games with limited rest accumulate higher rates of turnovers and reduced shooting efficiency according to league tracking systems, which in turn affects how oddsmakers set and adjust lines throughout a season. Observers note that these patterns become especially pronounced during stretches where clubs play four games in five nights or navigate cross-country travel followed immediately by another contest.
Defining Schedule Density in Professional Basketball Contexts
League schedules pack games into condensed windows because of broadcast demands and arena availability, yet the resulting back-to-backs and three-in-four sequences create measurable fatigue variables. Researchers tracking player tracking data have documented average declines in sprint speed and defensive closeout times when rest intervals drop below 48 hours, patterns that directly feed into the calculation of point spreads. Those who study these effects point to variables such as travel distance, time zone changes, and cumulative minutes played as compounding factors that oddsmakers incorporate through proprietary models.
Schedule density does not operate in isolation, because opponent strength and home-court advantage continue to exert primary influence, while secondary effects surface in the margins. Data indicates that road teams on the second night of a back-to-back cover spreads at lower rates than rested counterparts, a finding consistent across multiple seasons of box-score aggregation. Analysts compile these statistics by cross-referencing official game logs with travel reports released by team operations departments.
Performance Metrics Linked to Rest and Travel Patterns
Advanced metrics reveal clear divergences when teams operate under dense schedules, with offensive rating dropping by several points per 100 possessions in many documented cases. Defensive schemes suffer similarly because communication breakdowns increase after repeated high-minute outings, and these shifts appear in the raw numbers before they register in final scores. People who monitor line movement observe that sportsbooks often shade spreads by half a point or more once schedule density data enters public discussion ahead of tip-off.
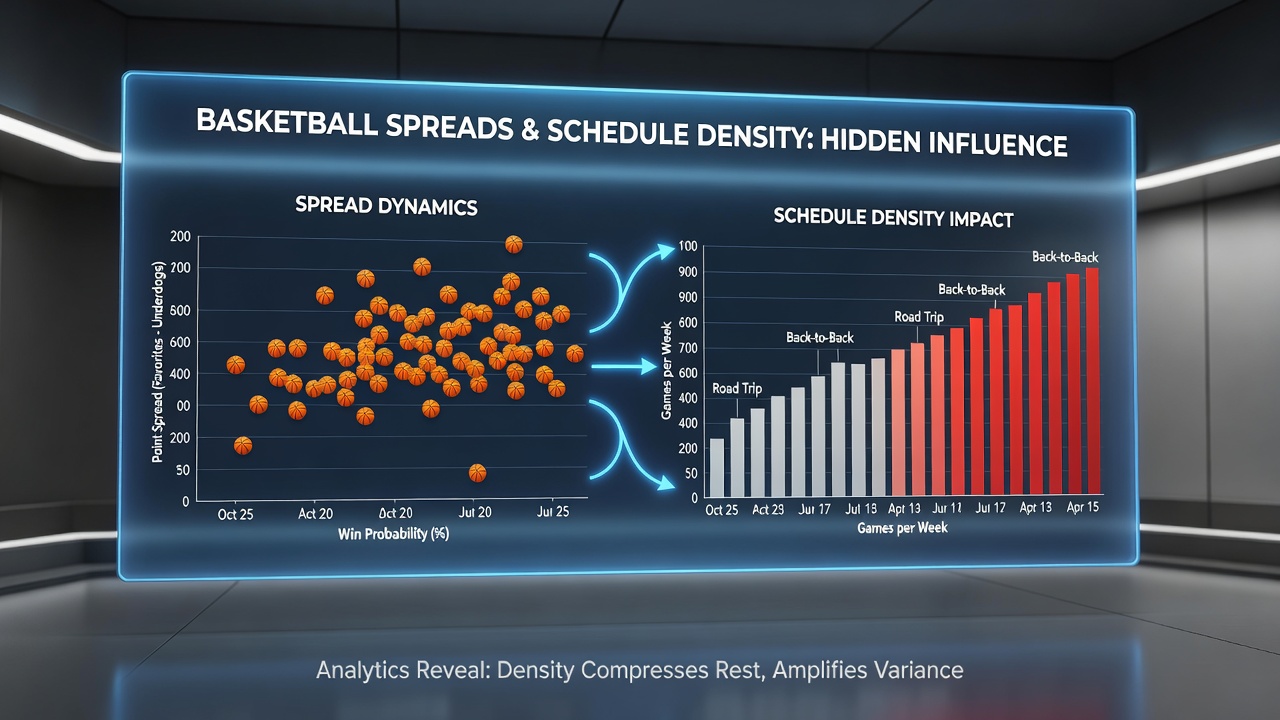
One study compiled by academic researchers at a major North American university examined five seasons of NBA data and isolated instances where teams played back-to-backs after 1,000-mile flights, finding statistically significant underperformance relative to spread expectations. Those findings align with separate reports issued by the National Basketball Association analytics portal, which publishes rest-advantage tables updated after each round of games. External factors such as altitude or arena climate can magnify these effects, yet schedule density remains the variable most consistently tied to margin deviations.
Market Adjustments and Line Movement Observations
Betting markets respond to schedule density signals through incremental line adjustments that accumulate across the betting window, with sharp action sometimes accelerating the process. Figures released by industry monitoring services show that spreads on dense-schedule road teams tend to move toward the rested opponent once injury reports and travel confirmations become available. This movement occurs because bettors and syndicates incorporate the same rest data that oddsmakers already model, creating a feedback loop visible in closing-line values.
July 2026 schedule releases will introduce new variables as teams navigate compressed playoff qualification windows, and preliminary projections from league operations indicate several clubs will face elevated density clusters in the final month of the regular season. Those patterns mirror historical stretches where late-season density correlated with larger-than-expected margin swings in divisional matchups.
Comparative Analysis Across Conferences and Seasons
Eastern and Western Conference schedules differ in travel burden, with Western teams logging more miles on average, and data sets from multiple seasons illustrate how these geographic realities translate into spread outcomes. Teams returning from a West Coast trip to play an Eastern Conference opponent on short rest have historically covered at reduced rates, a trend tracked through public box-score databases. Observers tracking these trends note that divisional games sometimes dampen the effect because familiarity offsets some fatigue disadvantages.
International comparisons provide additional context, with leagues such as Australia's NBL publishing similar rest-and-travel studies that echo NBA findings, although roster depth and game frequency differ. The consistency across borders suggests the underlying physiological mechanisms remain stable regardless of league structure or rule variations.
Conclusion
Schedule density functions as a measurable input within basketball point spread calculations, supported by performance data, travel records, and line movement patterns compiled across seasons. Researchers continue to refine models that quantify these effects, and upcoming schedule releases will supply fresh datasets for verification. Market participants who integrate these variables alongside traditional factors gain access to additional layers of context already reflected in closing numbers.